Monitor Adoption and Usage
Measuring developer engagement and understanding their usage of your internal developer portal is critical to better serving their needs. Red Hat Developer Hub includes an Adoption Insights plugin that can be enbaled by platform engineering teams to view detailed analytics on adoption and engagement within the internal developer portal.
Key metrics available include:
-
Active users as a percentage of licensed users.
-
Top templates.
-
Top catalog entities.
-
Top plugins.
-
Top TechDocs.
-
Popular searches.
| The Adoption Insights plugin is current in Developer Preview. Refer to the Adoption Insights documentation for more information related to support. |
Platform Engineer Activity: Configure Adoption Insights
Adoption Insights is enabled by default as of Red Hat Developer Hub v1.8. This plugin requires additional configuration to display accurate user metrics. Specifically, the licensedUsers configuration is used to provide accurate insight into the usage of Red Hat Developer Hub by actual versus licensed number of users.
-
Open your values.yaml file.
-
Make sure you’re logged in to GitLab as
pe1/{common_password}. -
Select Edit > Edit single file.
-
Scroll down in the values.yaml file and find the
--- ADOPTION INSIGHTS ---block in theappConfig.appconfiguration.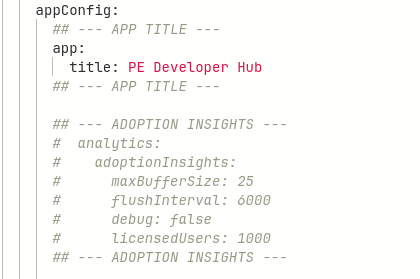
-
Highlight and uncomment the configuration in this block of YAML.
-
Scroll down and enter a commit message:
feat: enable adoption insights plugin -
Click the Commit changes button.
As you’re familiar with by now, you can refresh the backstage Application in OpenShift GitOps and to deploy the new Red Hat Developer Hub configuration. The Adoption Insights plugin will be available from Administration > Adoption Insights when the deployment has finished, but no data is available yet.
Developer Activity: Generate Additional Data for Adoption Insights
Once the new deployment has finished you’ll need to interact with Red Hat Developer Hub to generate events that the Adoption Insights dashboard can display. There are a few ways to do this:
-
Open a private browsing session and login as user
dev1using the password{common_password}. -
While logged in as
dev1anddev2: -
Use the Search Bar in the top navigation menu to find APIs and Components.
-
Visit the Docs page and view the documentation for your Quarkus application.
-
Generate a new application using the Quarkus Software Template.
Perform multiple searches and view multiple APIs and Components to generate sufficient data for the next step. Logout and perform the same steps using the dev2 user.
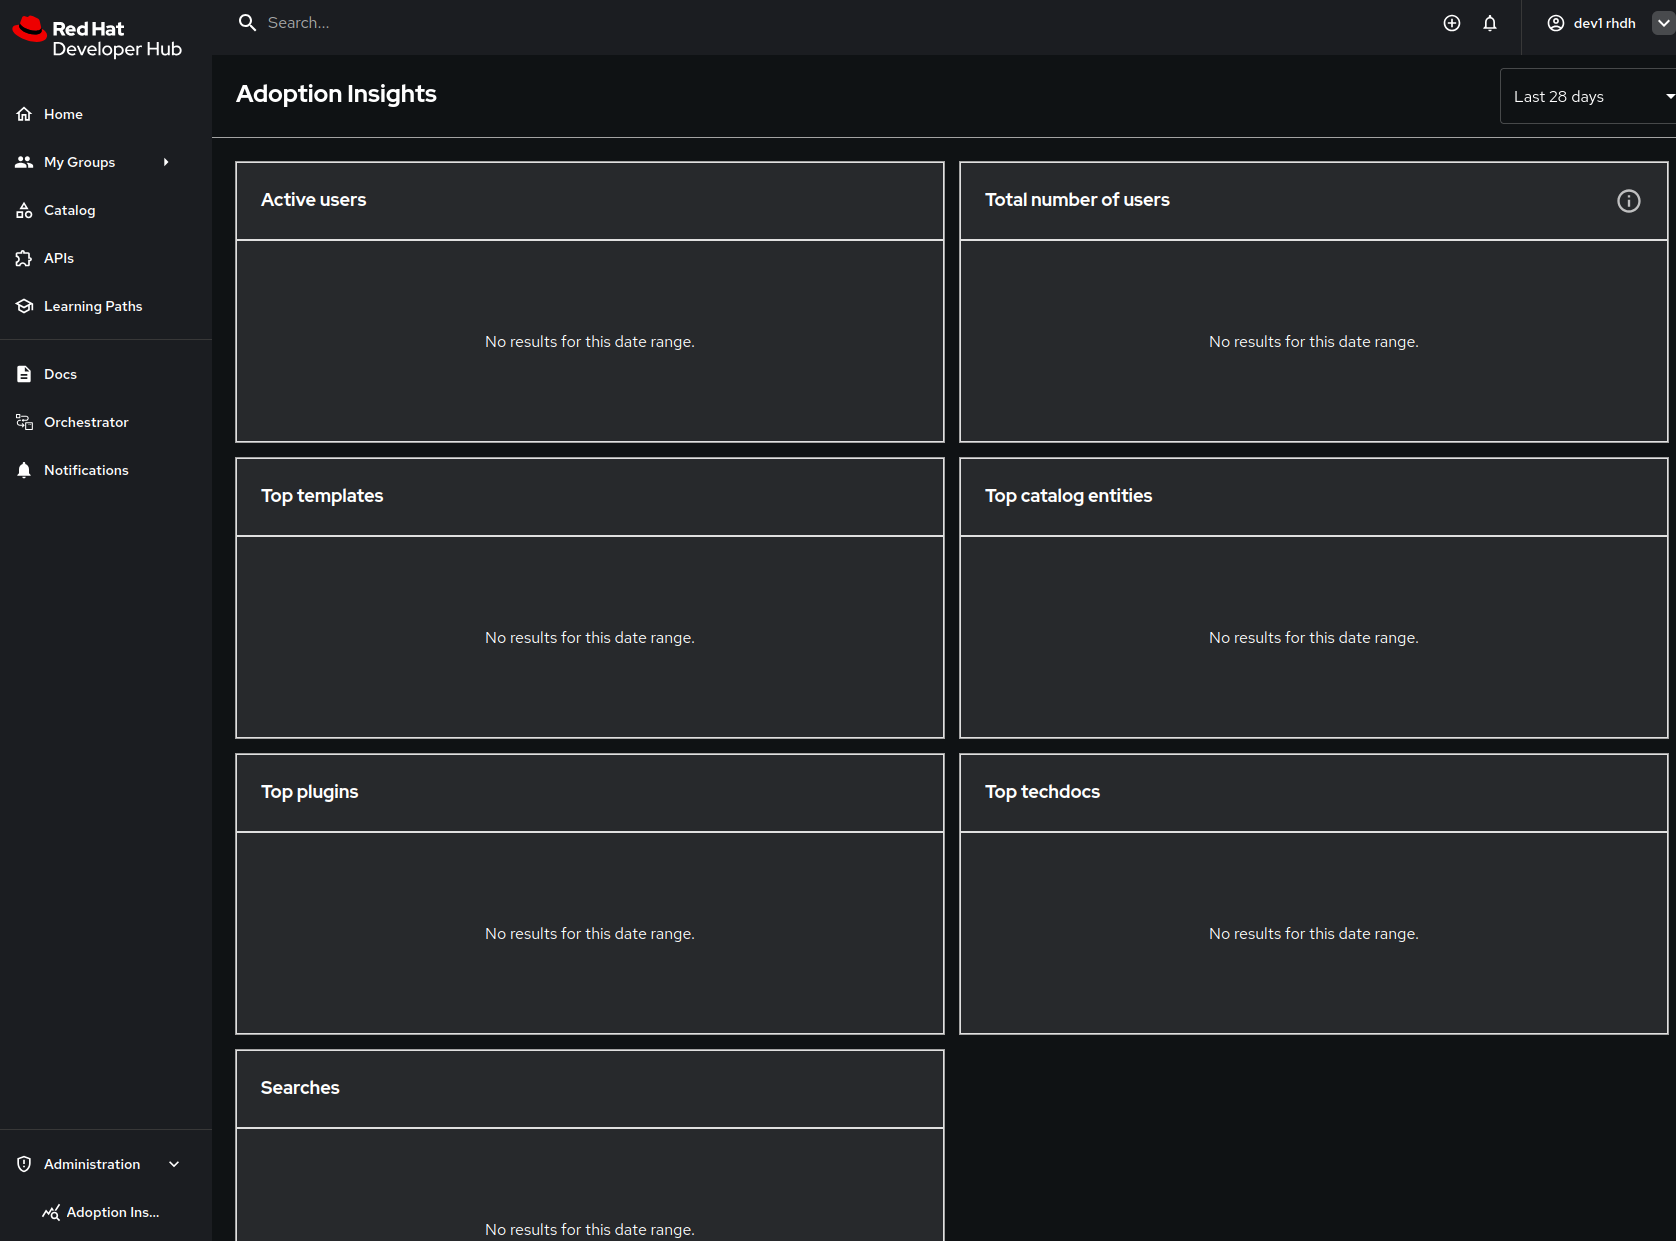
Platform Engineer Activity: View Adoption Insights
Now that you’ve generated some events, login to Red Hat Developer Hub as the pe1 user. Expand the Administration section in the side menu and click the Adoption Insights link.
Conclusion
Understanding usage patterns and engagement with your internal developer portal can help you better tailor your application platform to address developer needs, and demonstrate to stakeholders that the portal is a valuable developer productivity tool. The Adoption Insights plugin provides you with the data you need for both of these use cases.