Observability
As a Platform Engineer and Red Hat Developer Hub administrator, you can track user activities, system events, and data changes with Developer Hub audit logs. These logs are accessible through the Red Hat OpenShift Container Platform web console, where administrators can view, search, filter, and manage log data.
Monitoring and logging
In OpenShift Container Platform, metrics are exposed through an HTTP service endpoint under the /metrics path. You can create a ServiceMonitor custom resource (CR) to scrape metrics from a service endpoint in a user-defined project.
Set up monitoring for user-defined projects
To begin, create create the cluster-monitoring-config ConfigMap object:
-
Navigate to the OpenShift console. Login as admin/{common_password} if prompted.
-
Select the
 icon on the top navigation bar of OpenShift Console to create a new resource.
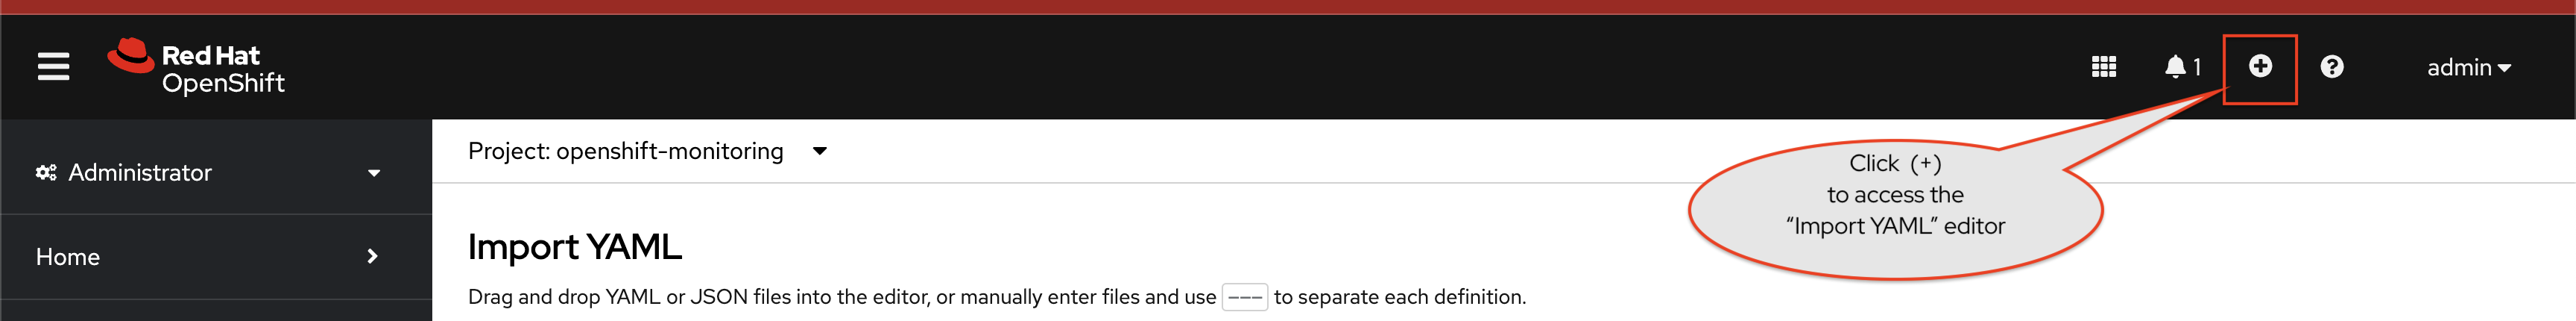
-
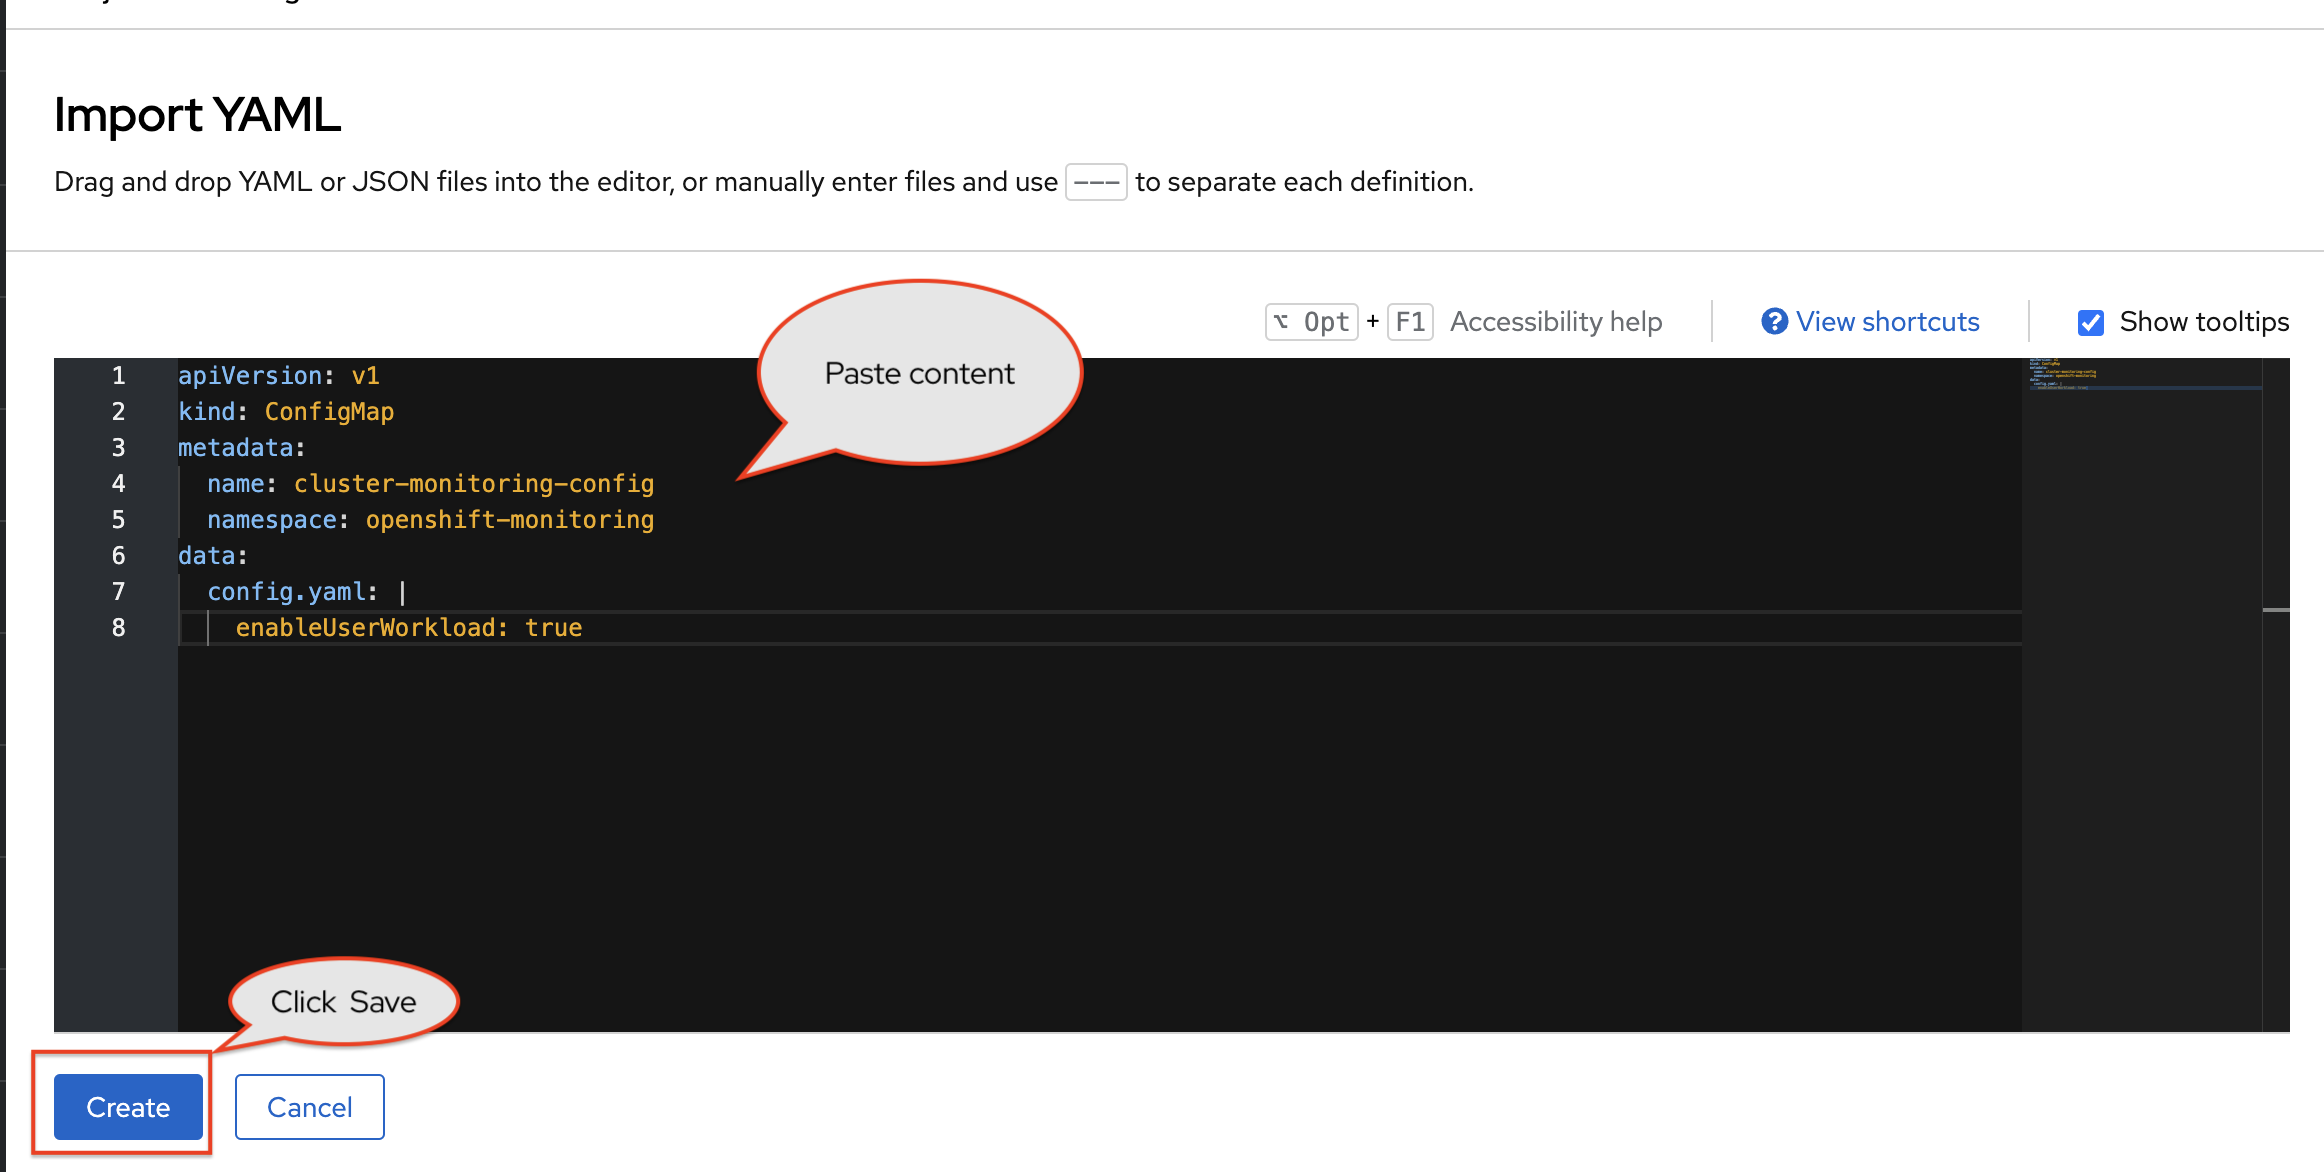
In the YAML editor, input the following ConfigMap. Setting the
enableUserWorkloadparameter totrue, enables monitoring of user-defined projects in the OpenShift cluster.apiVersion: v1 kind: ConfigMap metadata: name: cluster-monitoring-config namespace: openshift-monitoring data: config.yaml: | enableUserWorkload: true -
Click the Save button to create this ConfigMap.
Enable metrics monitoring on OpenShift
Next, enable metrics monitoring for Red Hat Developer Hub.
-
Open your values.yaml file.
-
Select Edit > Edit single file. Login as a Platform Engineer with
pe1/{common_password}when prompted. -
Find the YAML surrounded by
--- MONITORING ---and uncomment this section by highlighting the lines, and pressingCMD + /orCTRL + /.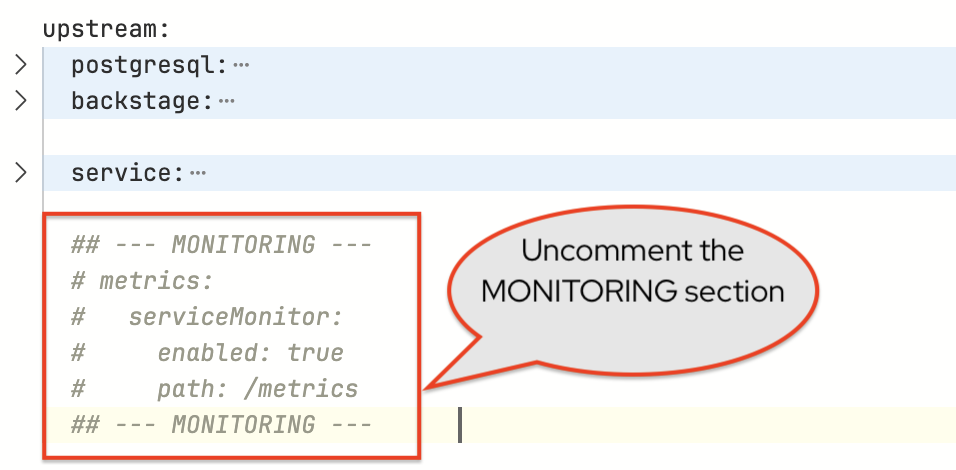
-
Scroll down and enter a commit message
feat: Enable monitoring. -
Click the Commit changes button.
Refresh the backstage Argo CD application
To apply the changes
-
Navigate to view the
backstageArgo CD Application in OpenShift GitOps. Login asadmin/{openshift_gitops_password}if prompted. -
Click the Refresh button for the
backstageArgo CD application. -
Wait until the Application status is Healthy.
-
A new
servicemonitorfor Red Hat Developer Hub should now be created. You can verify this by viewing thebackstageArgo CD application.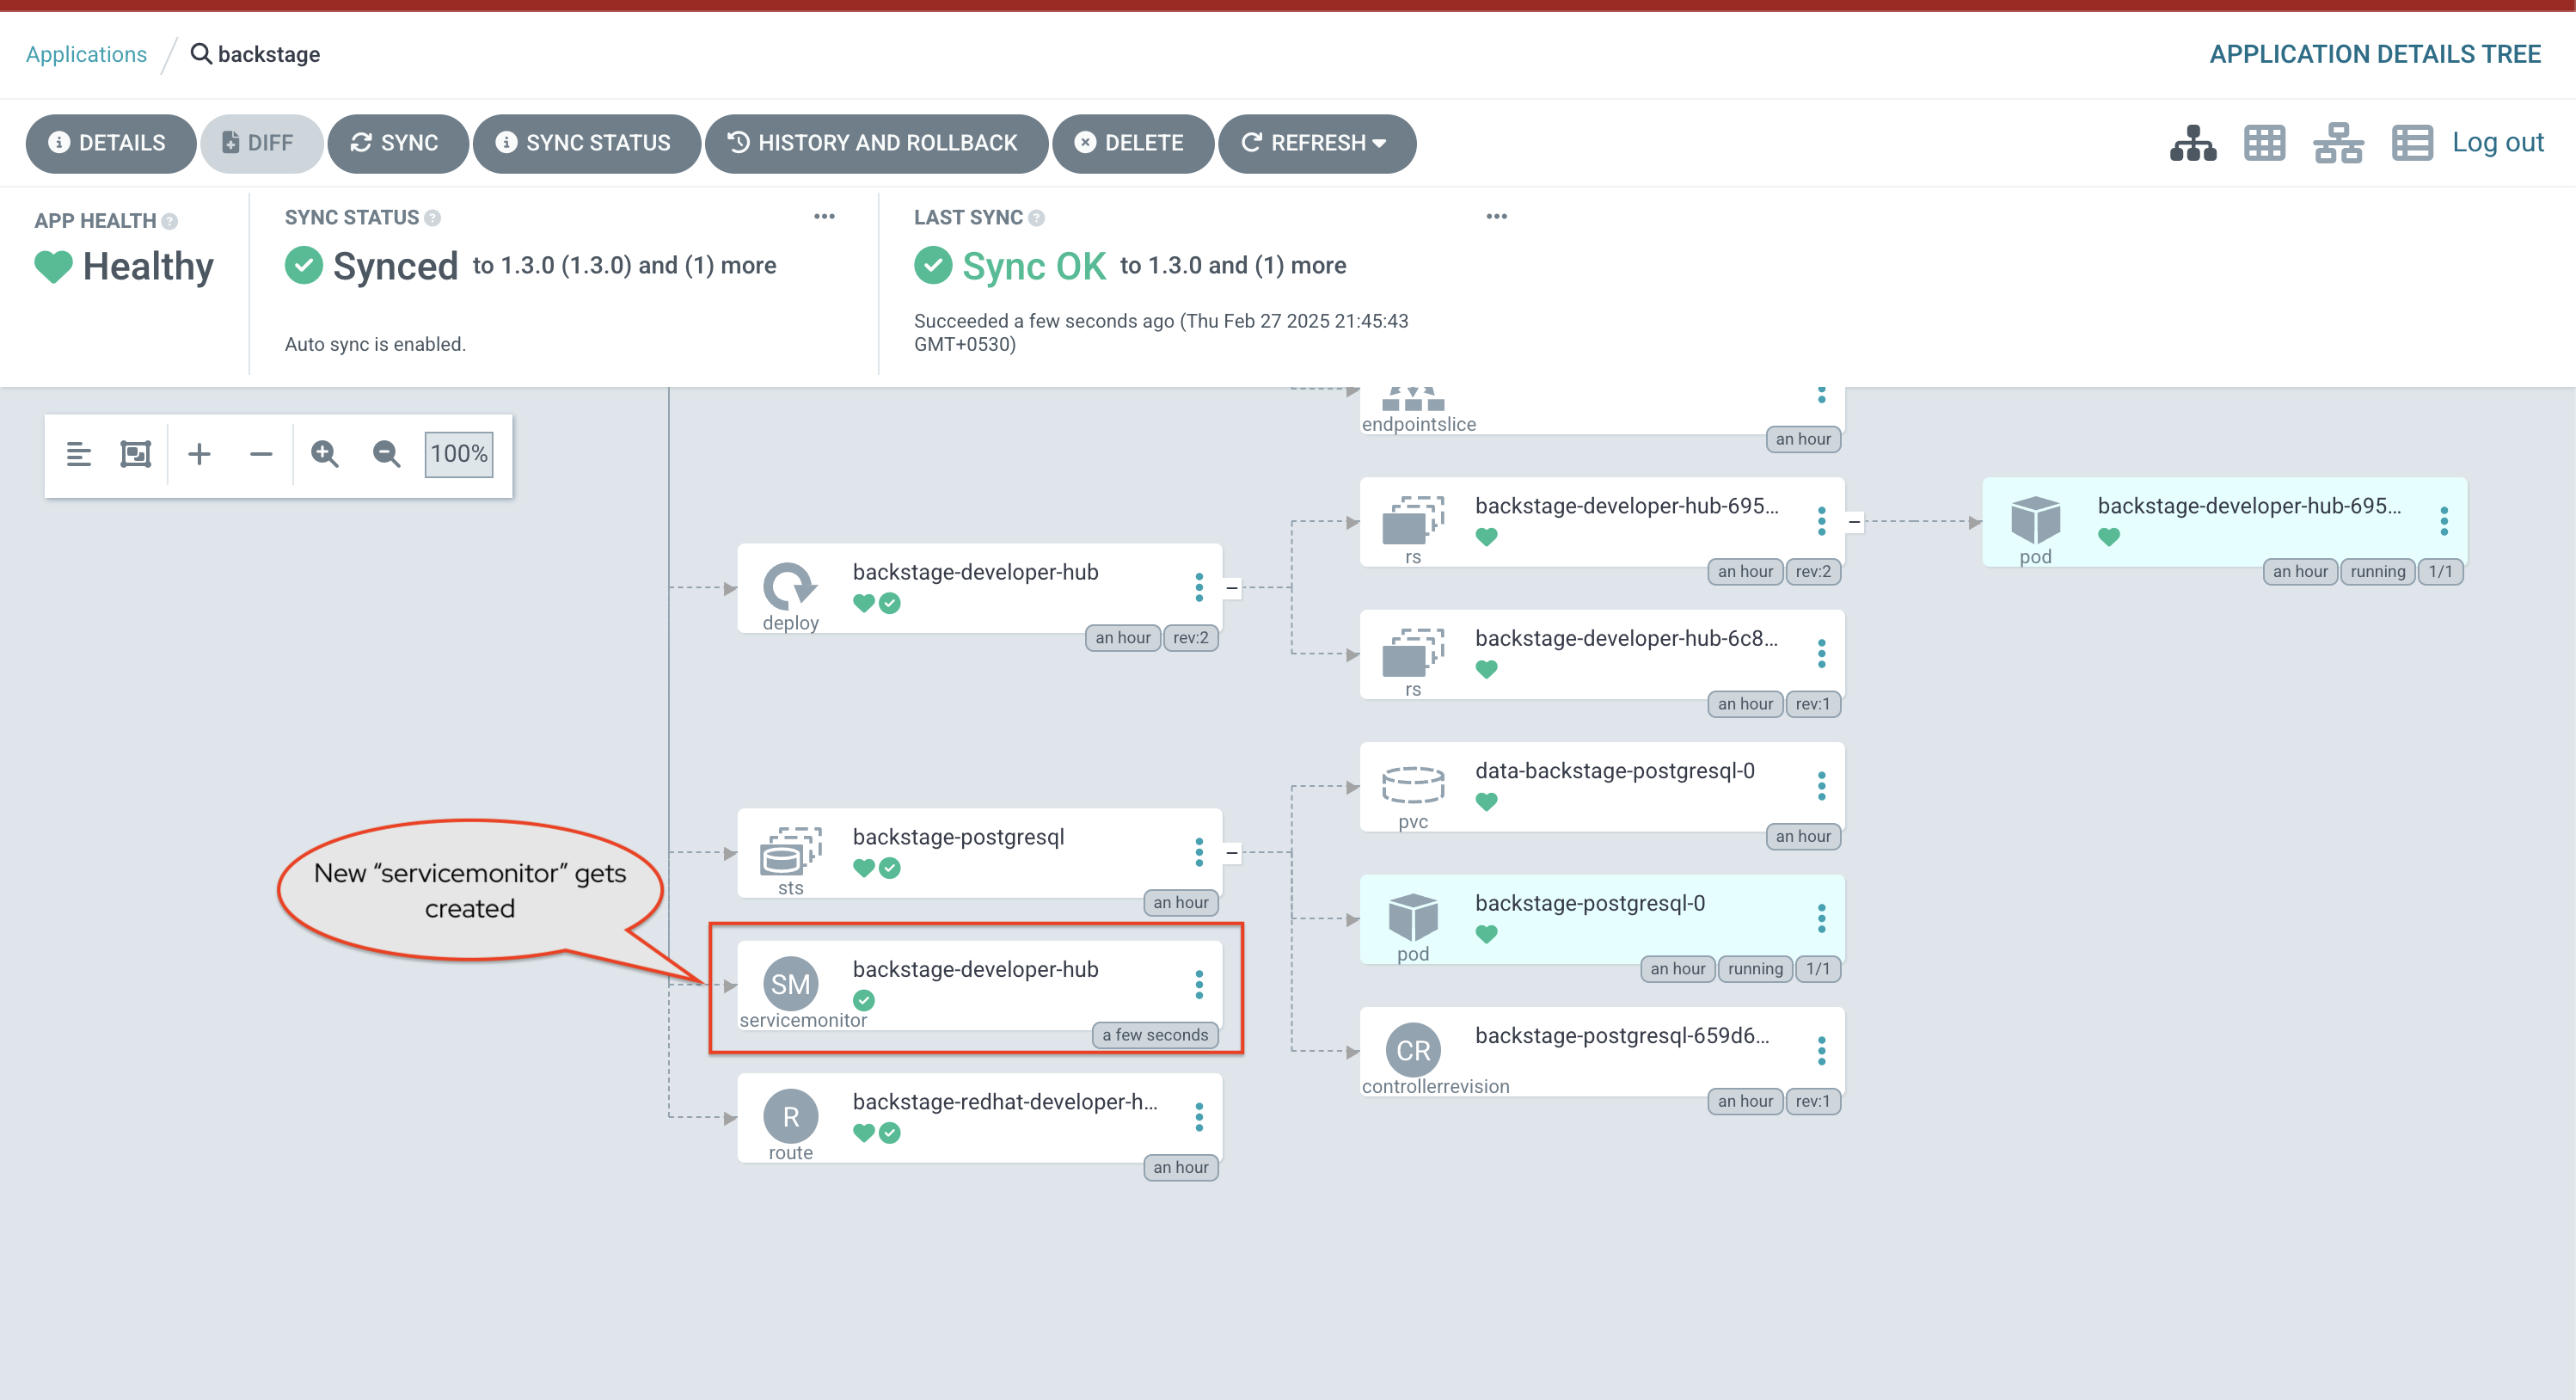
View Red Hat Developer Hub metrics on OpenShift
You can view the Red Hat Developer Hub’s metrics from the Developer perspective of the OpenShift web console within the backstage namespace
-
Visit the metrics page to view this Observe menu on OpenShift
-
Click the Metrics tab, and from the
Select querydrop down, chooseCustom query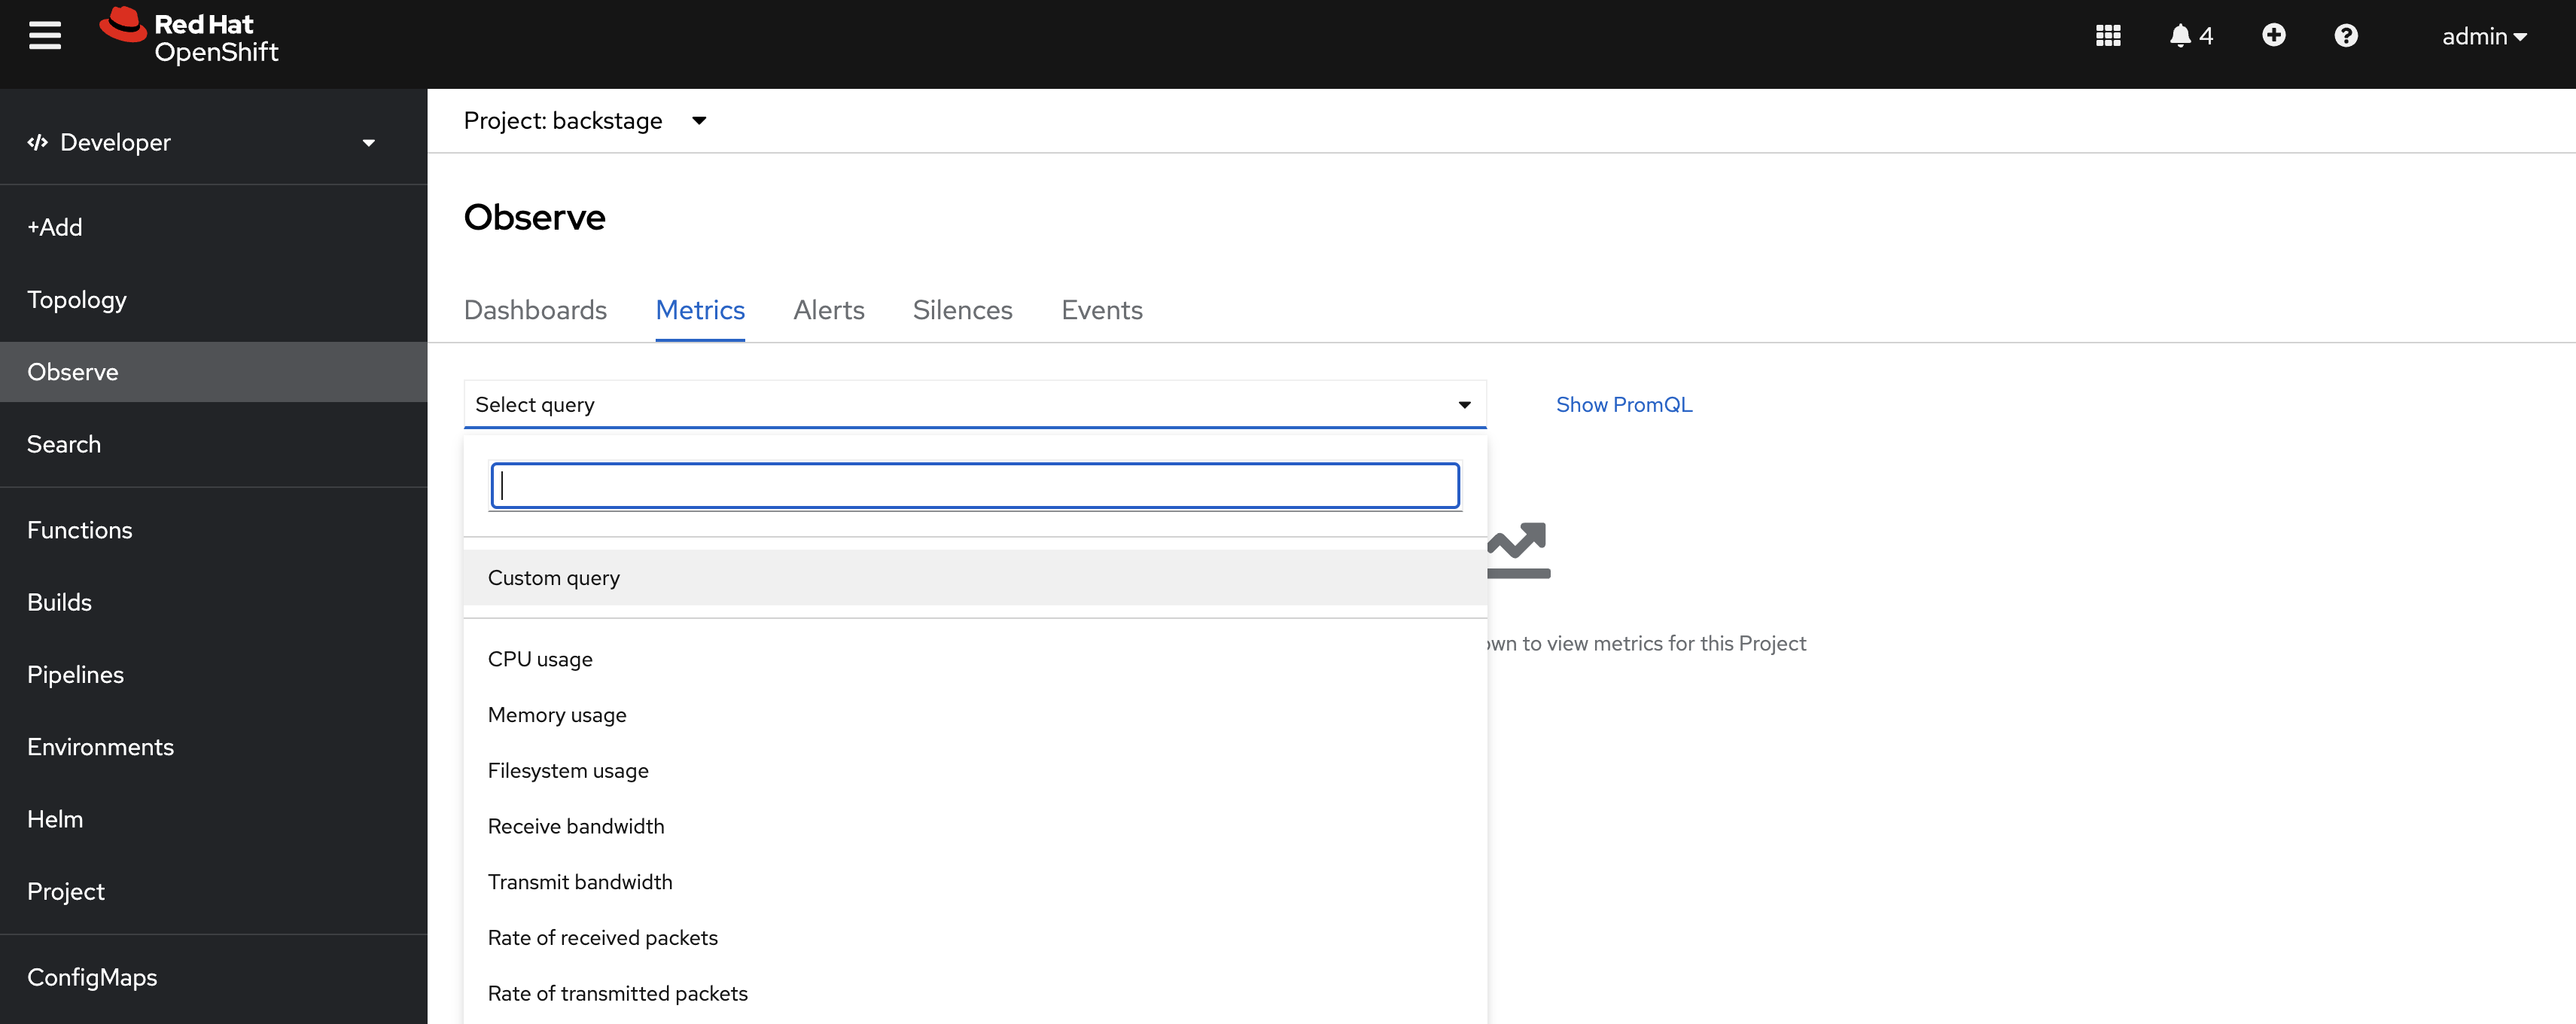
-
You can query a number of parameters by entering a query into the the
Expressiontext area,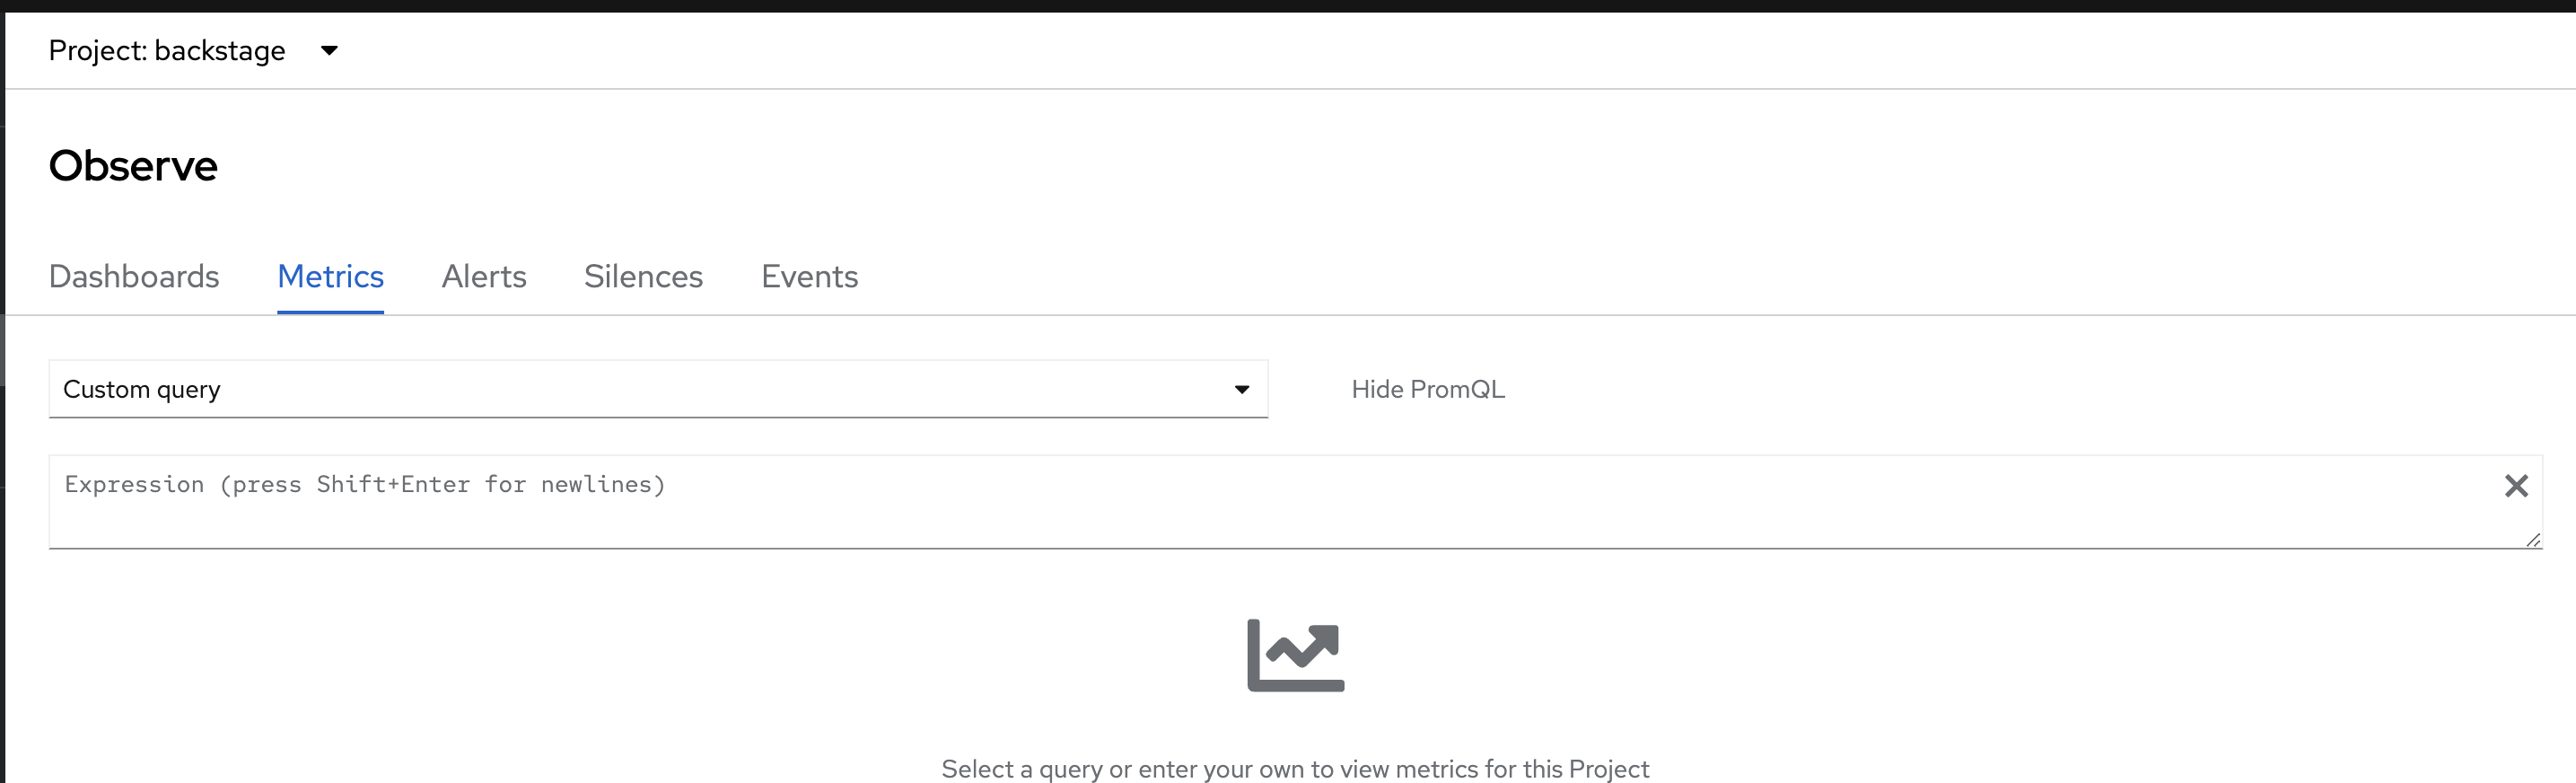
-
Enter
catalog_entities_countinto the textarea and hitEnterto view metrics such as how many components, users, templates etc are present in the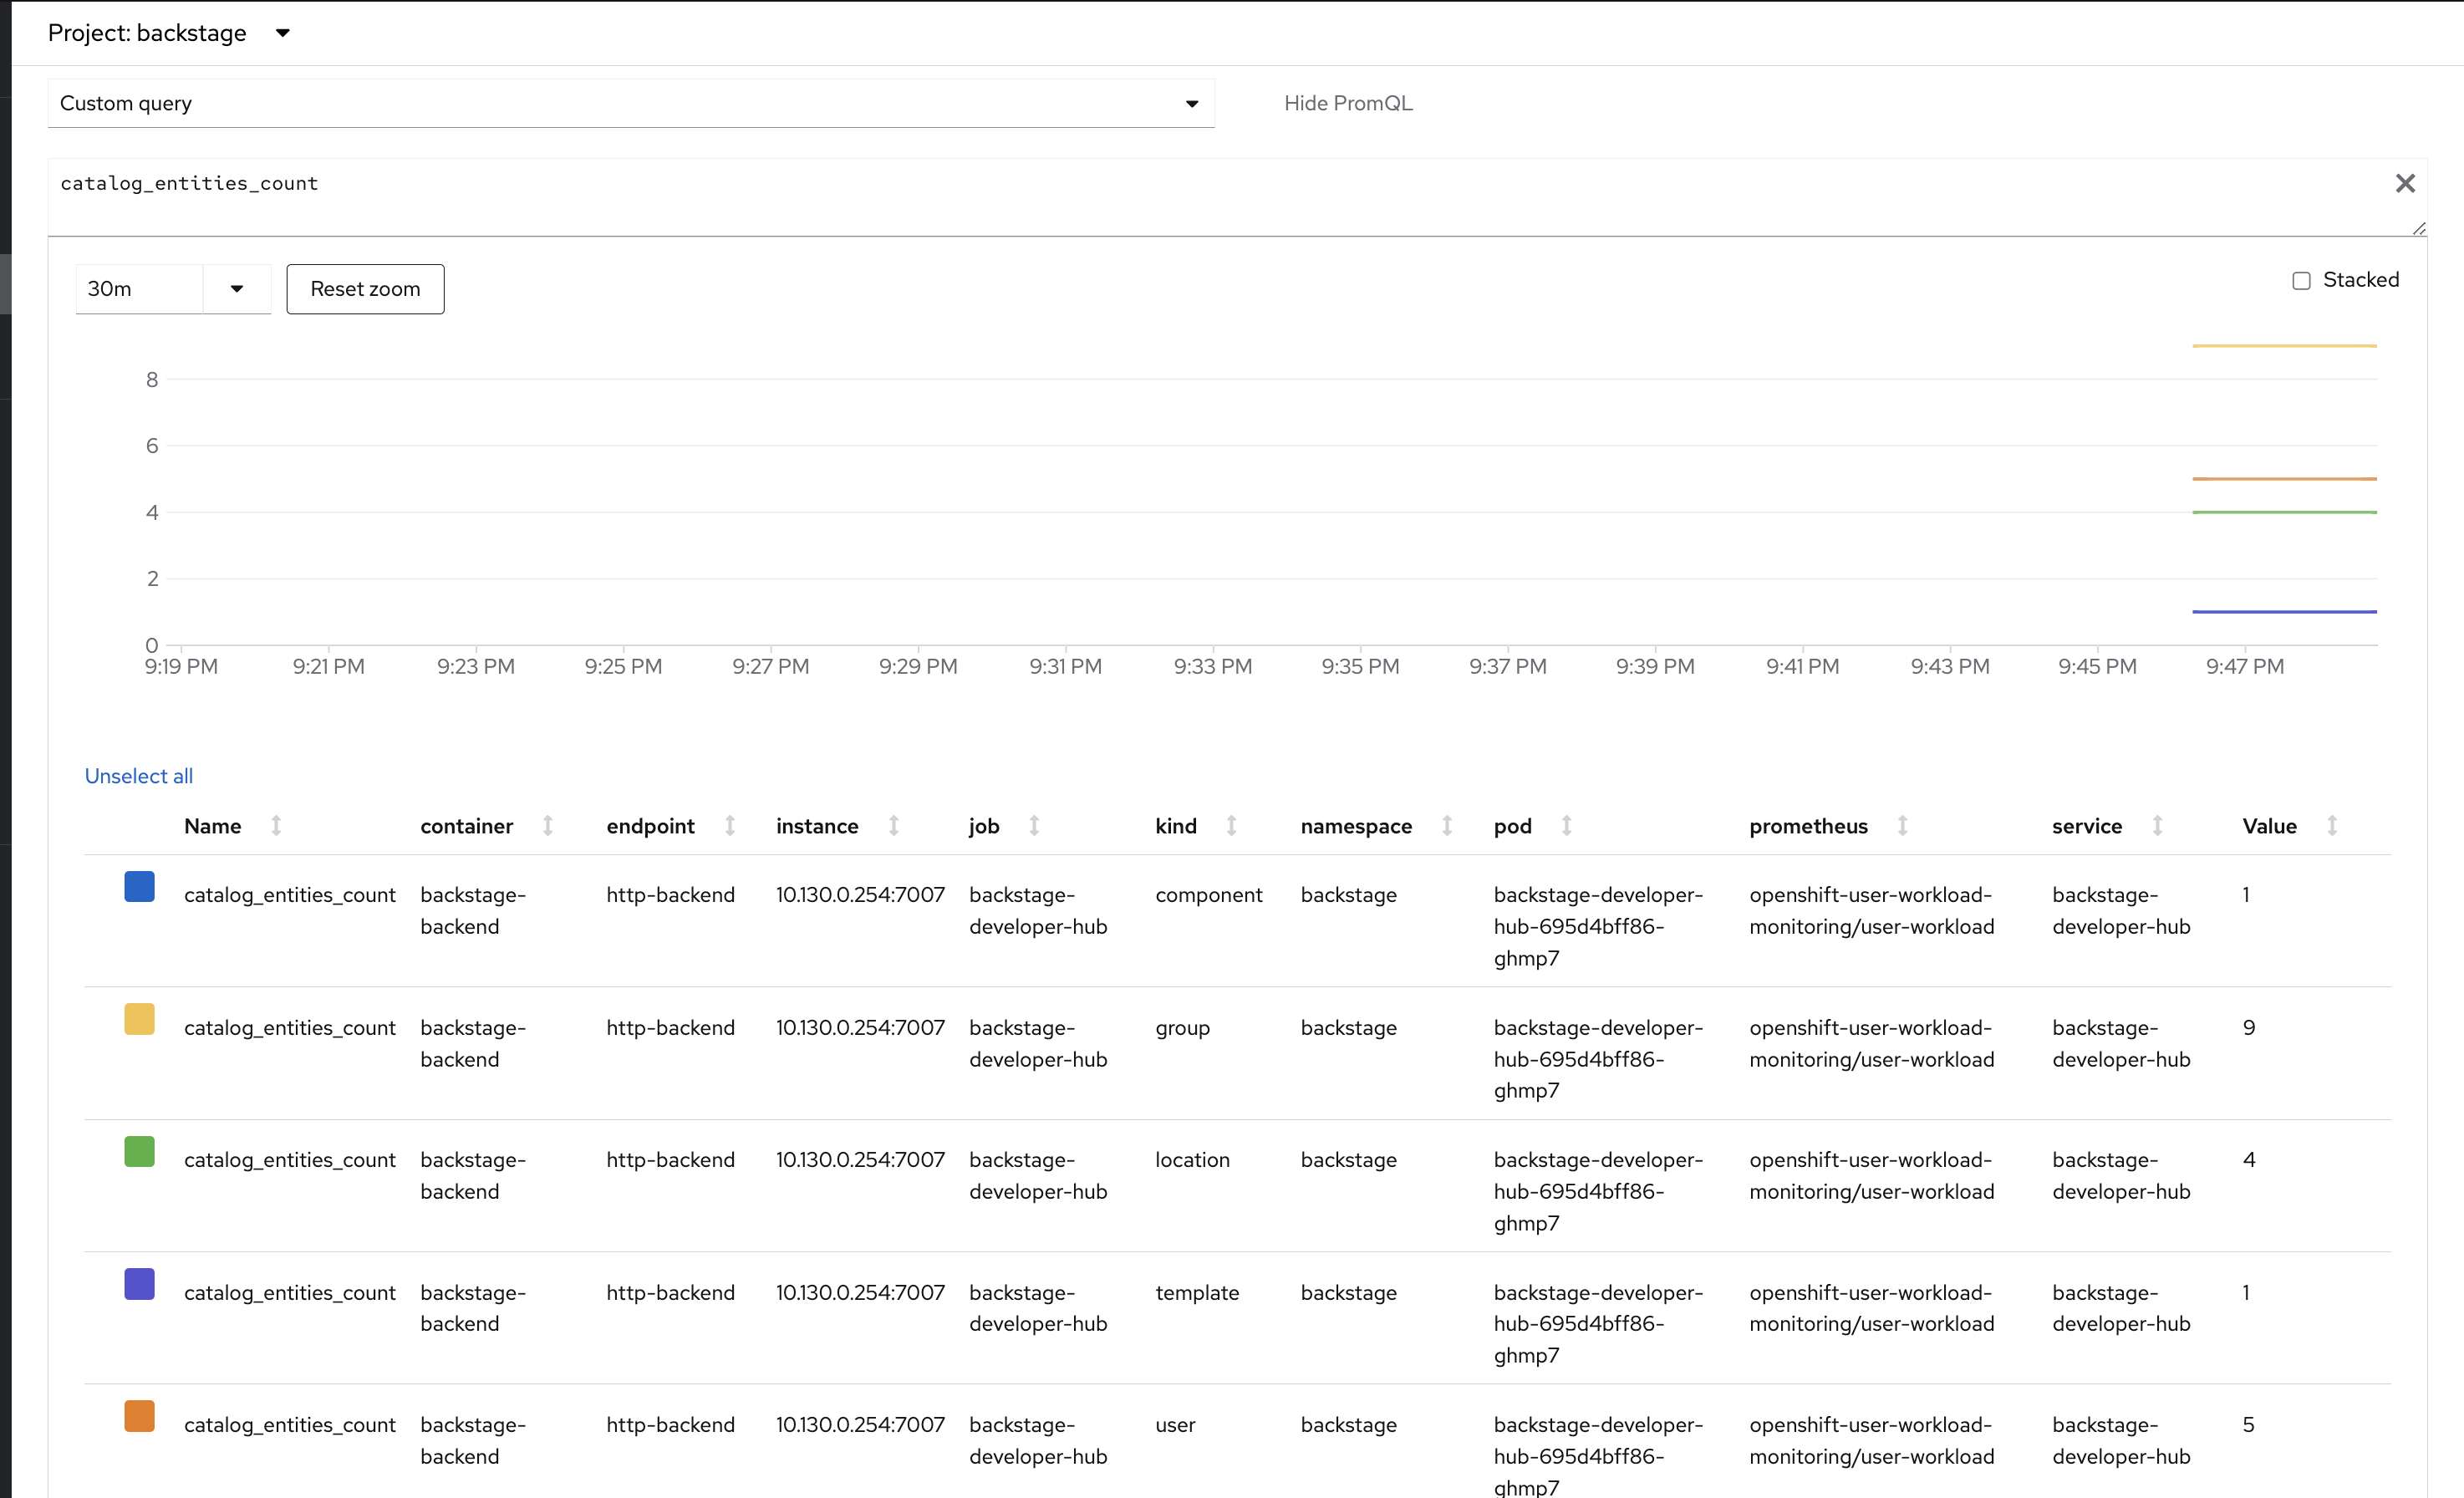
-
scaffolder_task_countresults in the count and user details
-
Other examples are
scaffolder_step_count,scaffolder_task_countcan yield interesting info about the template usage as well. The below screenshot shows output forscaffolder_step_count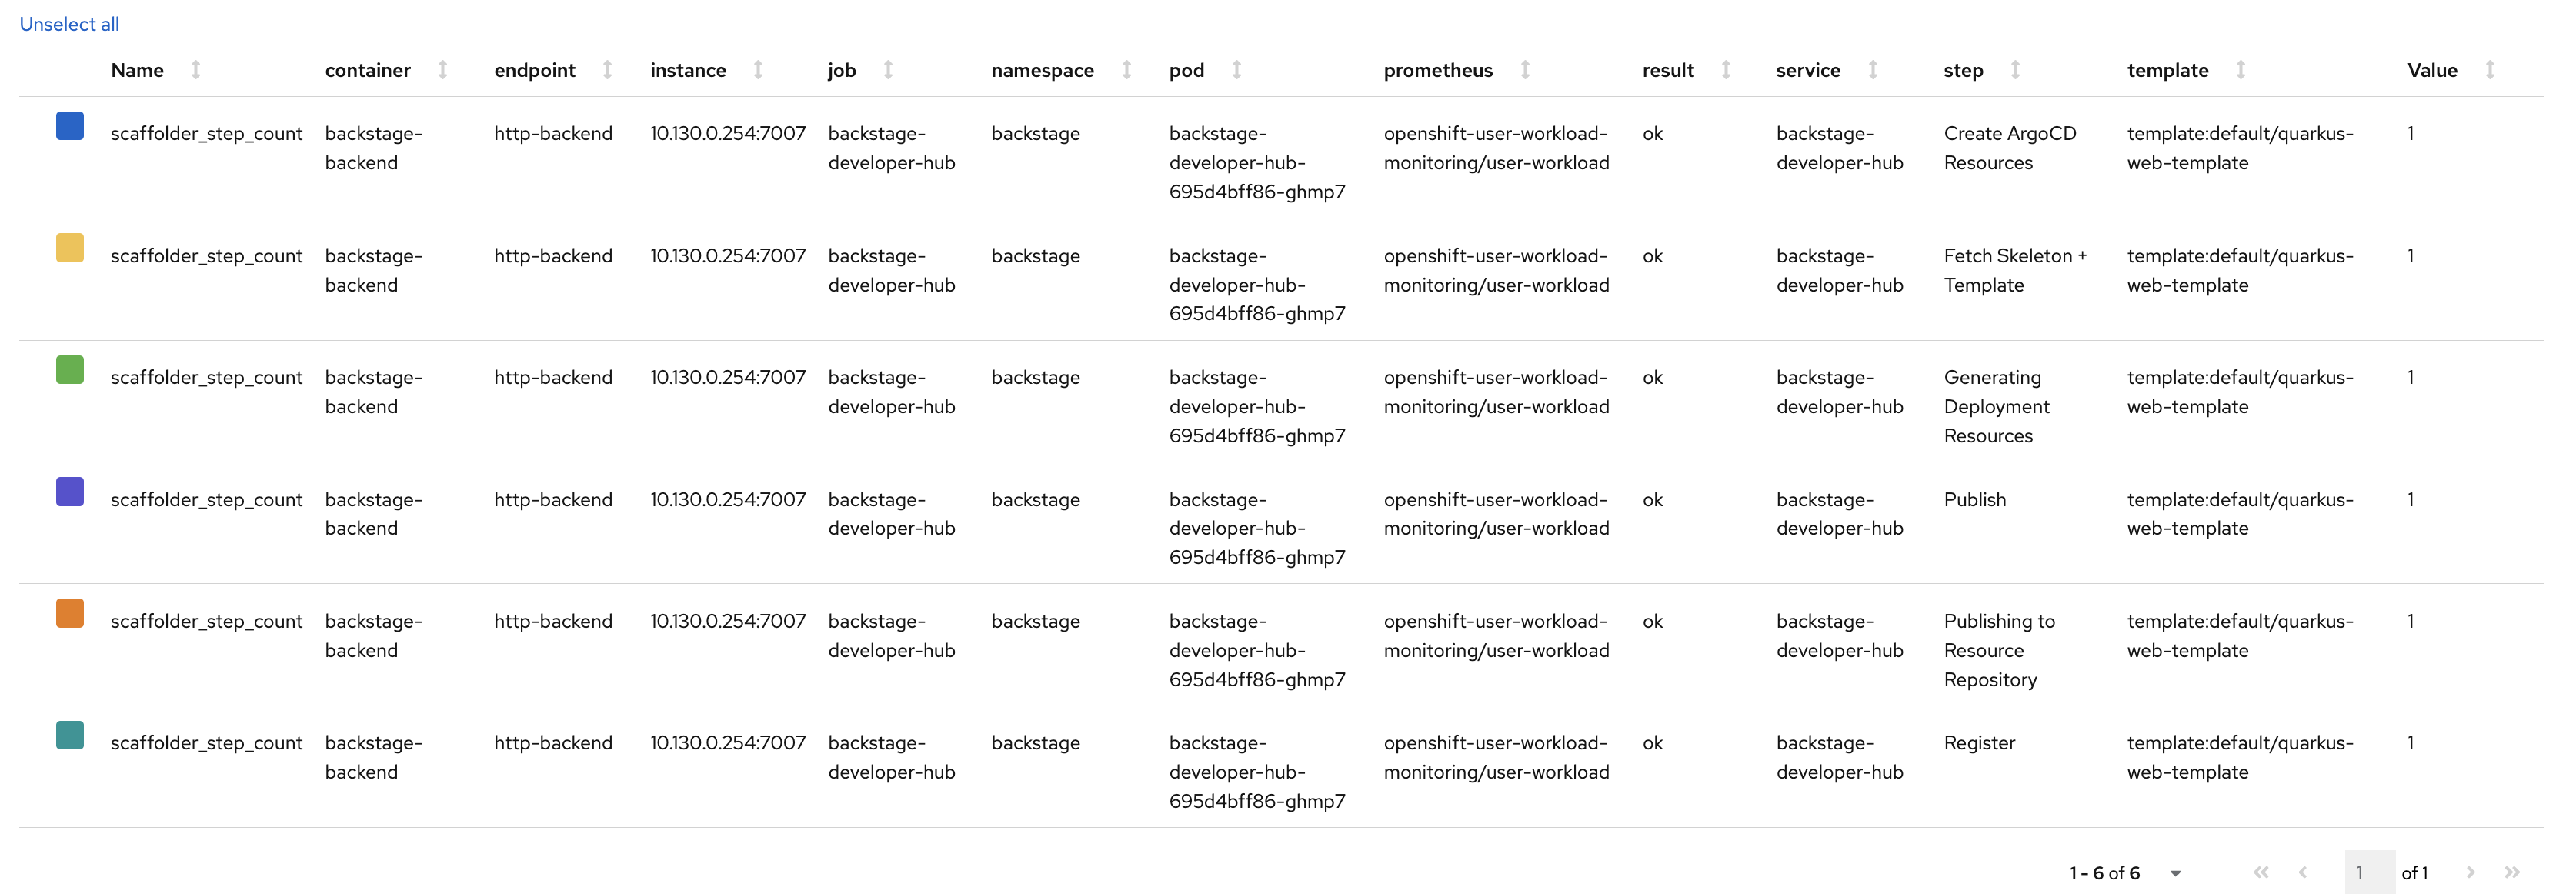
-
-
You can leverage the metrics to build custom Grafana dashboards to visualise them as well.
Audit logging and Telemetry
You can monitor user activities, system events, and data changes with Developer Hub audit logs. Telemetry data collection supports collecting and analyzing telemetry data to enhance Red Hat Developer Hub experience.
These topics are beyond the scope of this workshop, but you can explore them further in the Observability section of Red Hat Developer Hub product documentation.