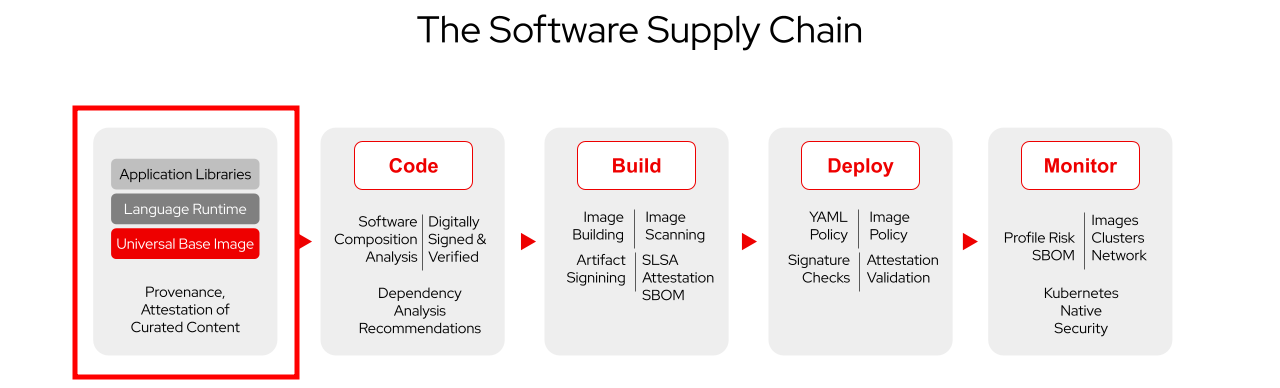
Supporting Developers: Dependency Analytics
As outlined before, building software implies the use of dependencies - today, nobody would develop their own logging framework, as an example. But there are more dependencies to the Software Supply Chain than the obvious code dependencies (more on that later). When building container images, our base image is also a dependency.
With that said (although not a core part of this workshop), we should consider consuming our dependencies from Trusted Sources wherever possible.
Examples are:
-
using (base-)images from Red Hat, as they have an "image health" rating, based on identified vulnerabilities and have been vetted by Red Hat experts.
-
using Java Maven dependencies from the JBoss Enterprise Maven Repository, if available.
As Platform Engineers, we can support our developers by providing templates that contain curated containerfiles with references to trusted images sources - similarly, dependencies files (e.g. pom.xml) with references to curated source dependencies to start with. Of course, our developers can change any of those - we want to support them, not tie their hands.
Which brings us to the core of this chapter:
Red Hat Dependency Analytics
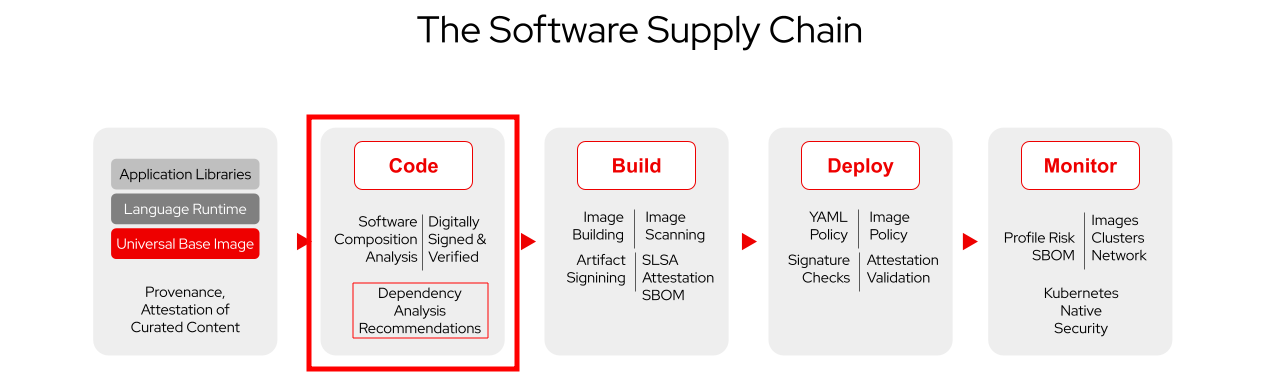
Shifting left security means to identify risks and vulnerabilities as early in the supply chain as possible - not when we’re trying to deploy them, or even worse, after deployment on our production systems. But, to accomplish this, we need to give our developers tools that allow them to identify these problems and make informed decisions.
This workshop primarily focuses on the Platform Engineer (PE) role. This workshop doesn’t require you to have an IDE on your laptop or any other local dependency. Therefore, this chapter is more informational. However, if you would like to give it a spin, expand the section below where we explain how to try it out locally. You need to have git and either VSCode or IntelliJ installed on your machine to follow this example.
|
Expand to try it out locally
| You can easily test and try it out by going to your VSCode or IntelliJ Marketplace (check the links) and run it on code you have on your laptop. Below you’ll find how to follow the workshop examples. |
To reproduce the examples further below in this chapter, please clone the parasol-store application:
-
Navigate to the parasol store component in Red Hat Developer Hub. If prompted, login as
dev1/{common_password}. -
Click on the View Source link to access the git repo of this Component.
-
Copy the HTTPS URL (this environment hasn’t been setup to allow ssh connections to GitLab)
-
Based on your local setup (mime-types configured) you can also try to open it directly in your preferred IDE
-
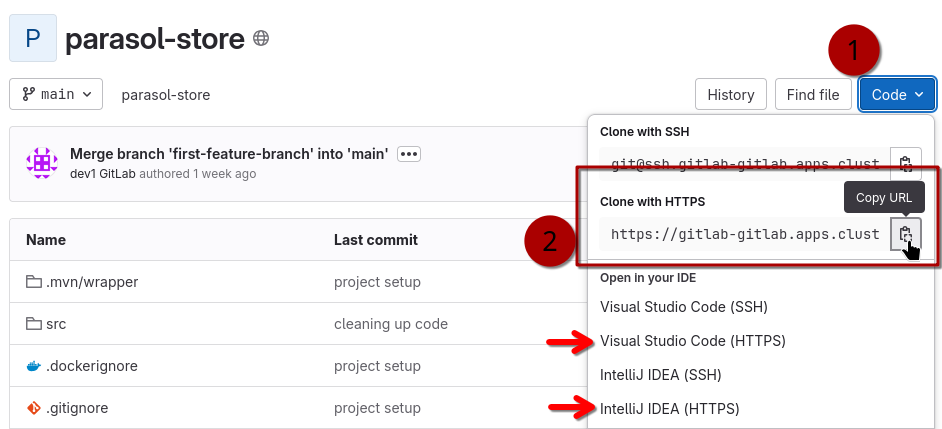
Then, use git clone to download it.
Or, for your convenience, use this:
git clone https://gitlab-gitlab.{openshift_cluster_ingress_domain}/parasol/parasol-store.gitWhen you open this repository, your IDE will automatically activate required plugins (VSCode) or ask you to activate them (IntelliJ), including Red Hat Dependency Analytics.
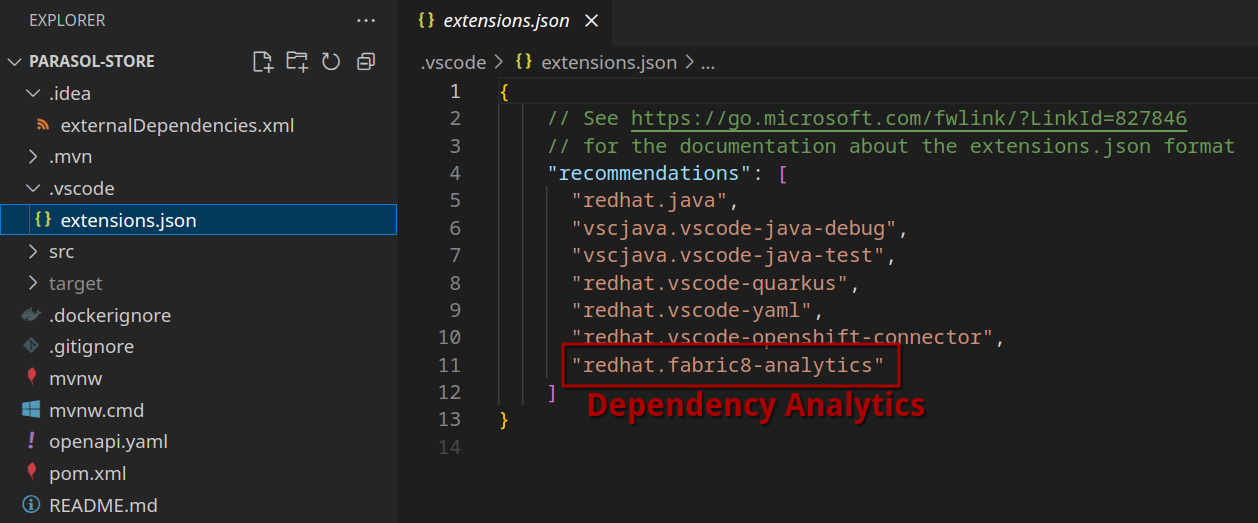
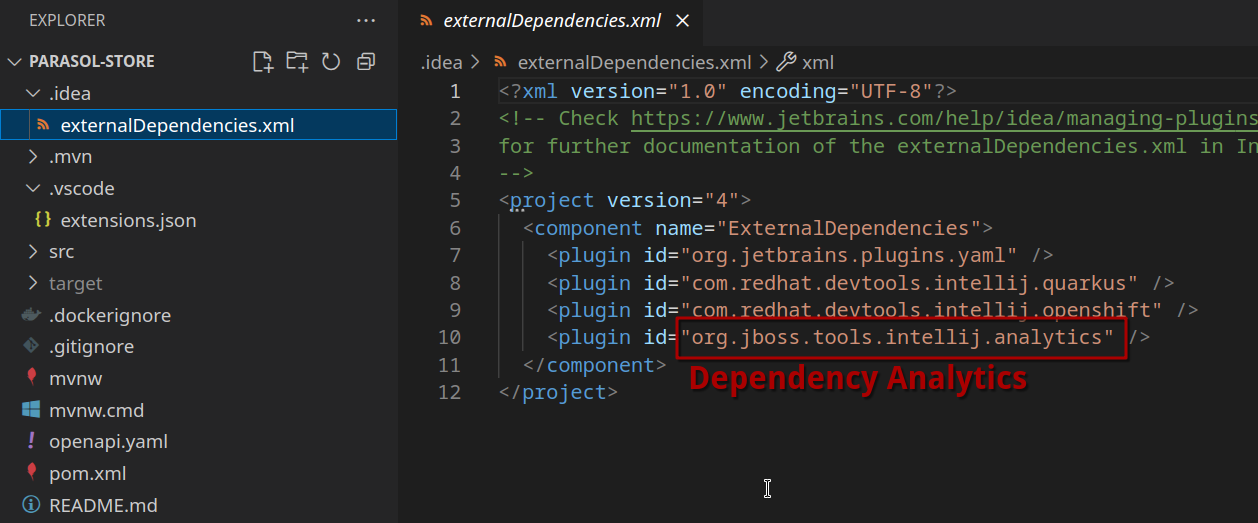
By including .vscode/extensions.json and .idea/externalDependencies.xml to the repository, the developer’s IDE will have the plugins that support them doing their job - in this case, identifying possible vulnerabilities via redhat.fabric8-analytics (VSCode) and org.jboss.tools.intellij.analytics (IntelliJ), respectively.
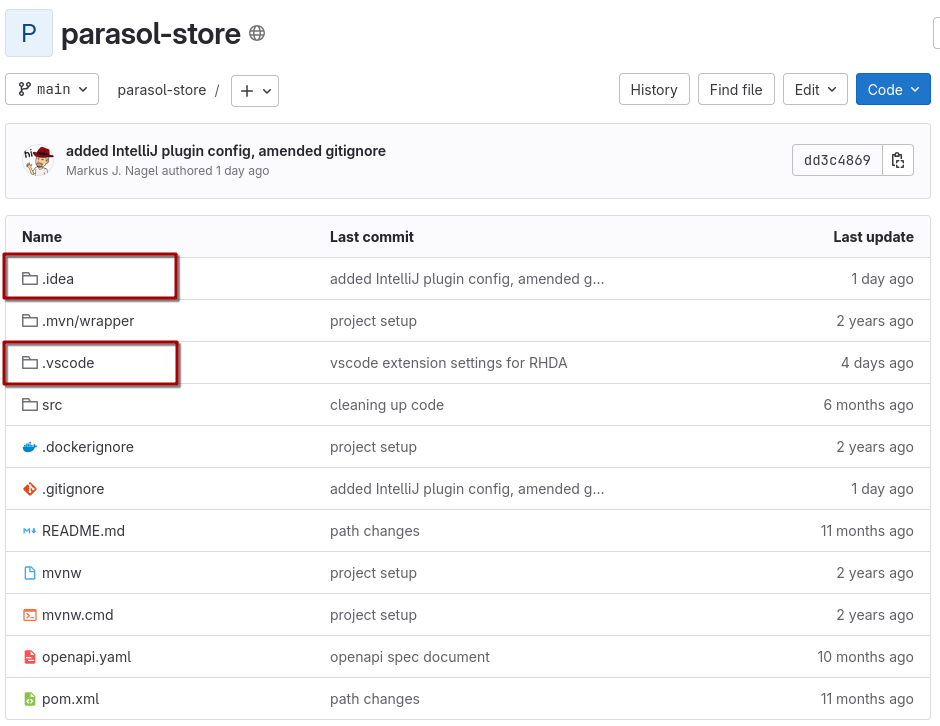
| As Platform Engineers, we can support our developers by adding appropriate plugin configuration to the Red Hat Developer Hub templates we provide them with. If you go back to Chapter 3, where we introduced templates, or take a look at the "skeleton" part of the simple template (the "code skeleton"), you can see that we included these files there as well. This way, you can add IDE plugins based on programming language, framework, etc - to make lives easier for developers starting new projects or components. |
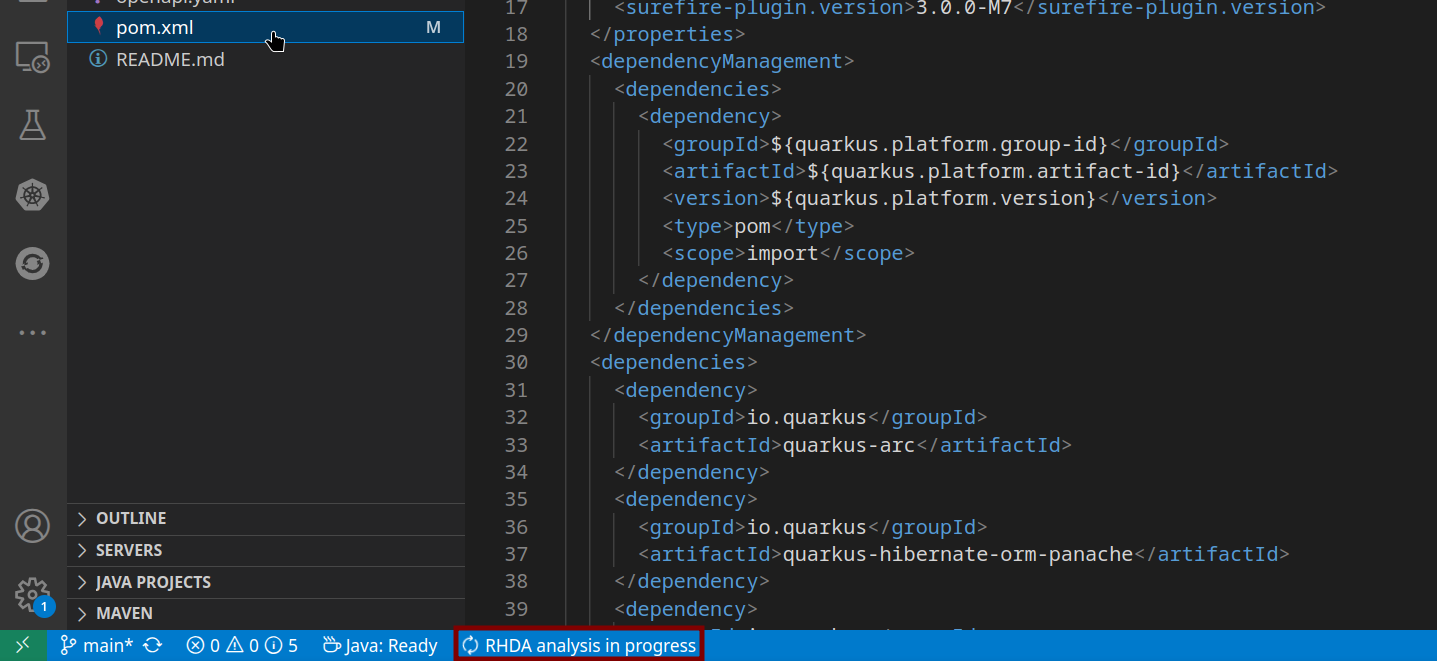
RHDA: Analysis
Opening a dependencies file (in our case, the pom.xml) automatically starts the analysis if the Plugin has been installed, as shown in the status bar:
RHDA: Results
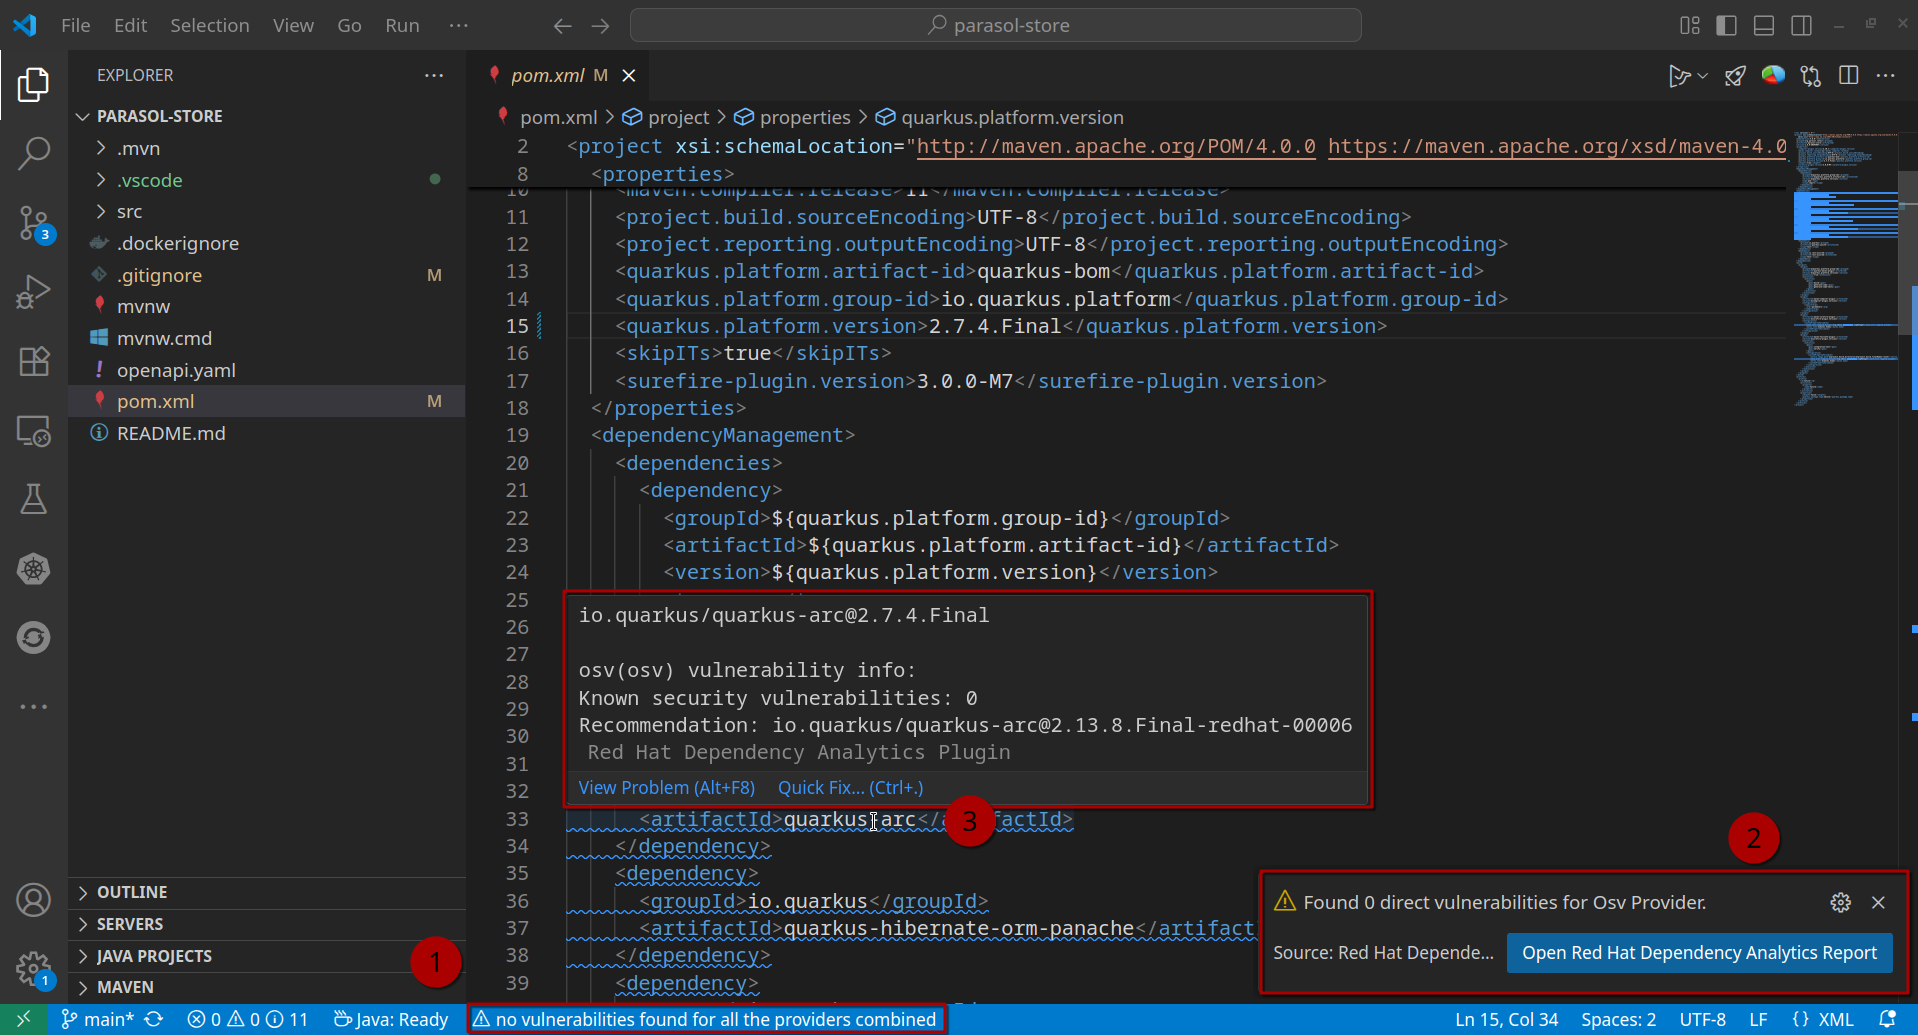
(1) Once the analysis has finished, the number of *direct* vulnerabilities (i.e. a dependency and version is listed as vulnerable) are shown in the status bar.
(2) A detailed reports (see below) can be generated, including transitive dependencies.
(3) In the dependencies file, even if there is no direct vulnerability, recommendations are issued. In our case, we are using an outdated version of the Quarkus platform (2.7.4.Final, which is also the Quarkus upstream build.)
The plugin recommends to upgrade to a newer version, which also is the Red Hat build: Recommendation: io.quarkus/quarkus-arc@2.13.8.Final-redhat-00006
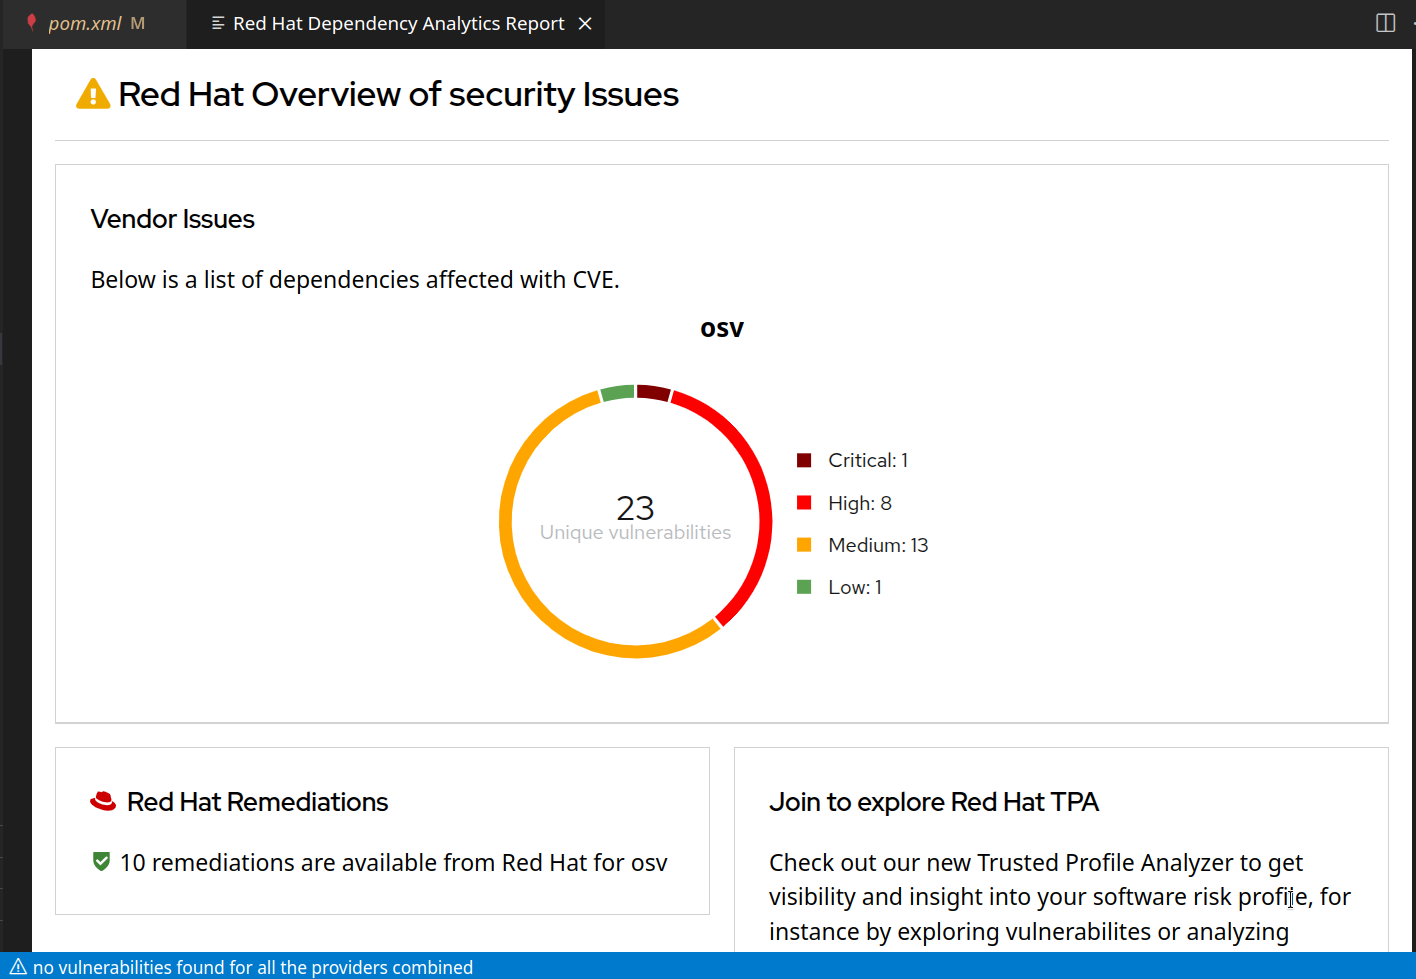
RHDA: Detailed Report
Opening the report gives us an overview of all vulnerabilities, direct or transitive:
Drilling deeper, we can see vulnerabilities in transitive dependencies, grouped by top-level dependency.
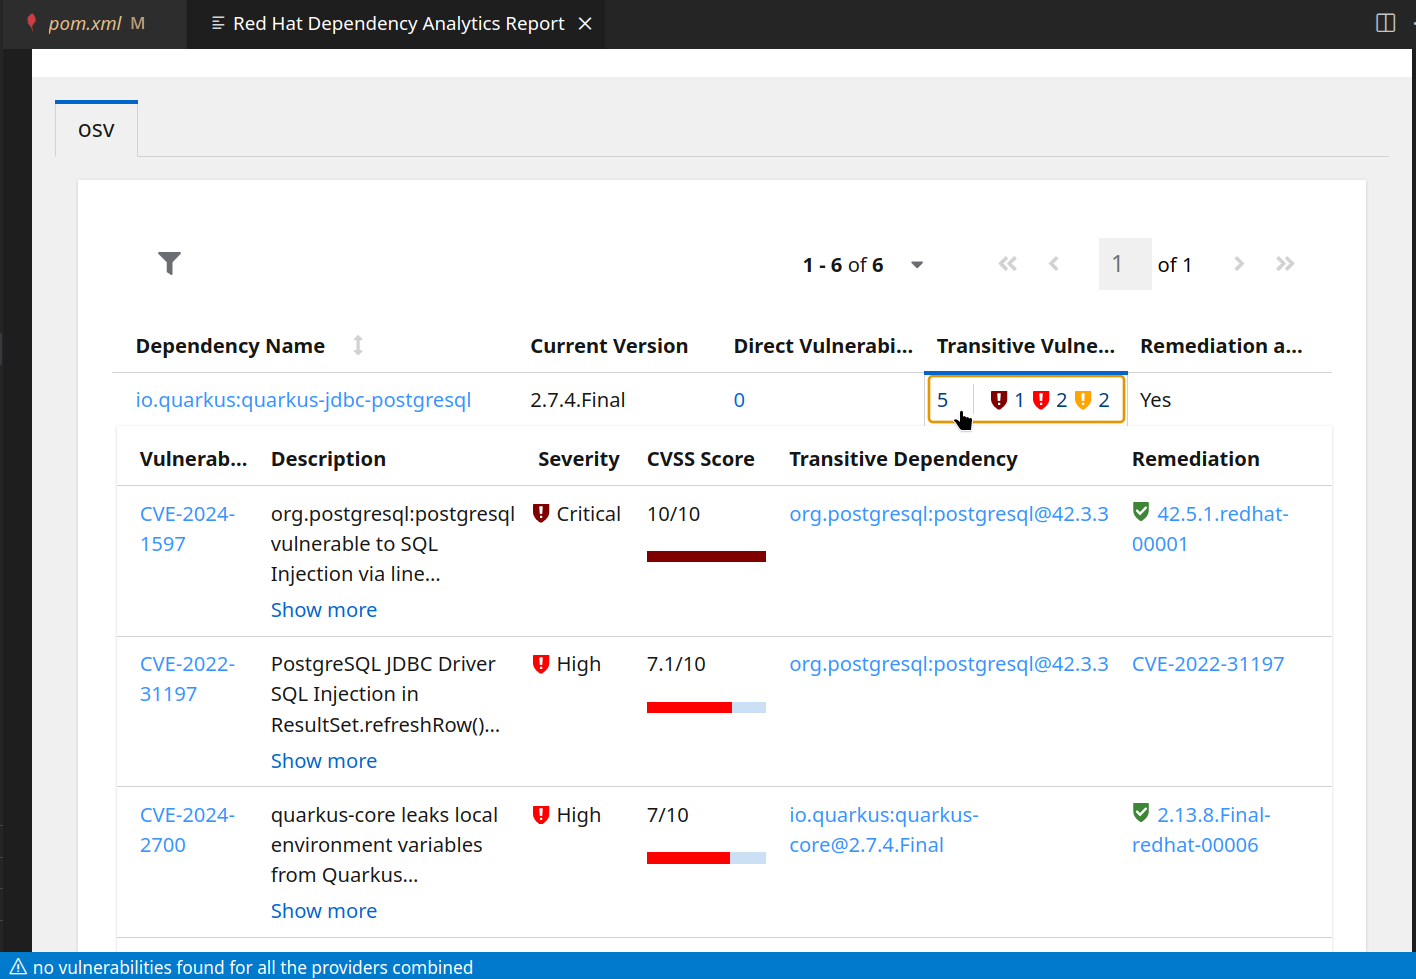
If there are known remediations, these are listed here as well, together with detailed information about the vulnerability in question - because not every vulnerability is equally dangerous. Some might be dependent on system settings or specific configurations.
Developers need this information to make informed decisions wether to upgrade the version, apply a remediation, mitigate the risk in some other way or accept and document it.
This is what Shifting-Left Security is all about.